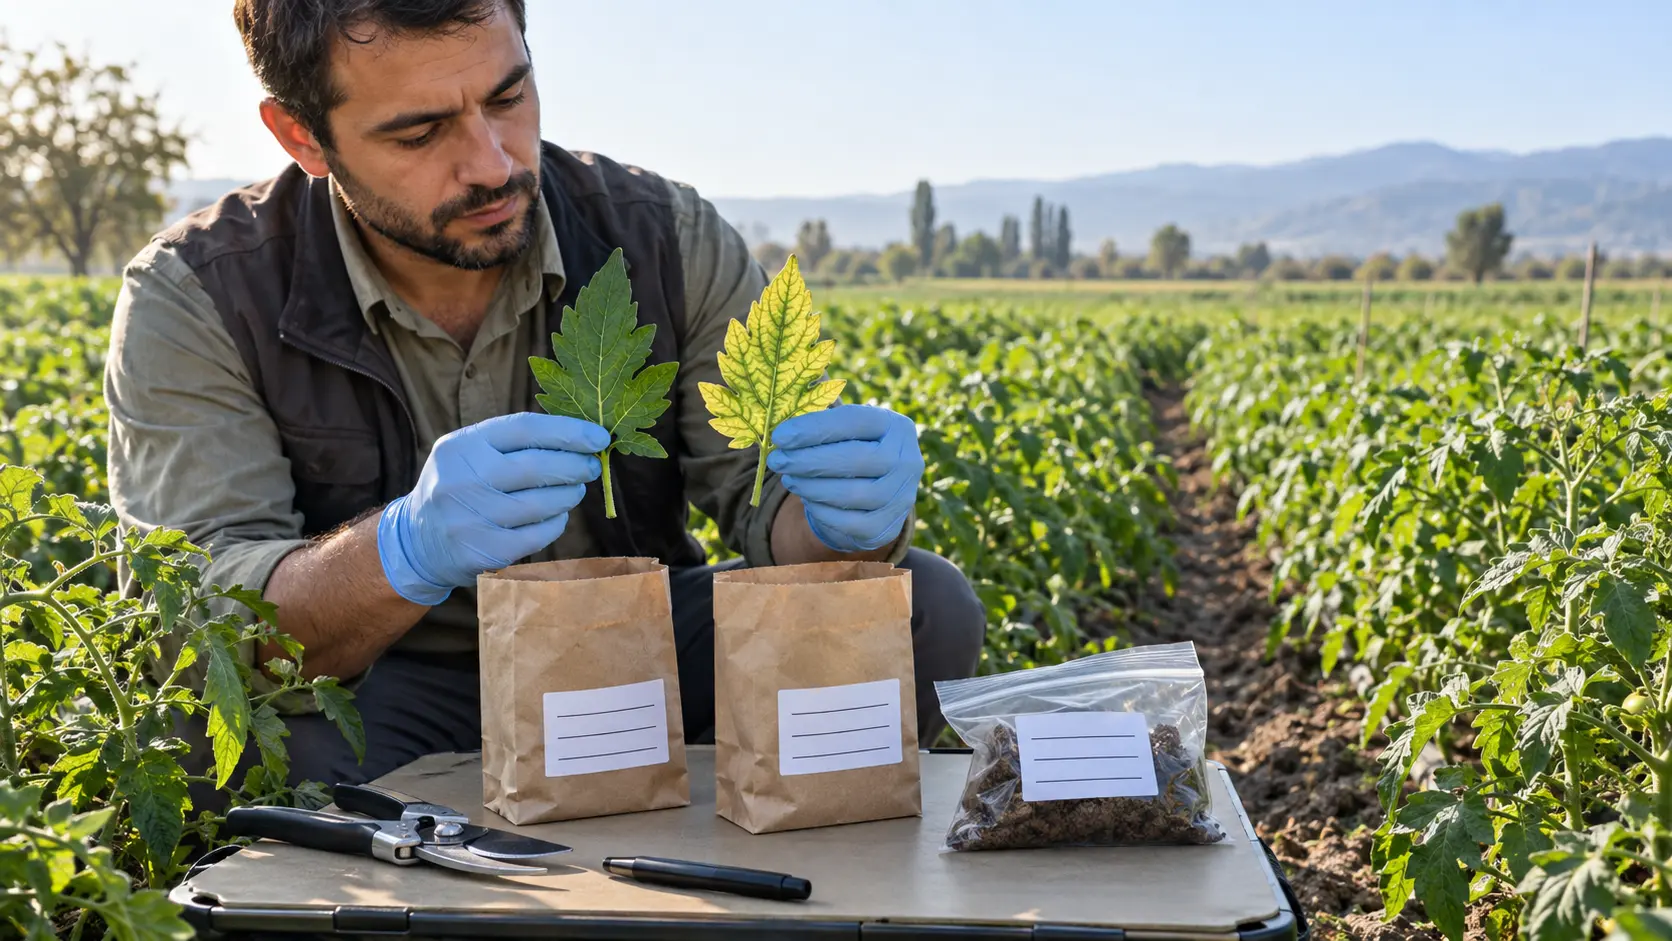
Yellowing, small leaves or weak growth can be consistent with micronutrient stress, but they are not a laboratory diagnosis. Root damage, waterlogging, drought, unsuitable pH, bicarbonate, salinity, disease and spray injury can produce similar patterns. A product decision made from colour alone risks treating the wrong cause.
Plant tissue analysis becomes useful when the crop, cultivar, growth stage, sampled organ and field zone are defined. Its strongest diagnostic form compares separate composite samples from affected and nearby normal plants and pairs them with soil or root-zone information. The result can then qualify a targeted Fe route or a broader Fe–Zn–Mn route without inventing a universal threshold or rate.
KEY TAKEAWAYS
- A symptom starts an investigation; it does not identify a nutrient or authorize a treatment.
- Use the laboratory's crop-, stage- and organ-specific sampling instructions and keep problem and normal zones separate.
- Interpret Fe, Zn and Mn with contamination history, paired soil data and the whole nutrient pattern—not one isolated number.
1. Define the diagnostic question
Write the question before sampling: is a named crop and cultivar in one management zone actually limited by Fe, Zn or Mn, and would a permitted corrective programme change the crop response? Record symptom position on young or old tissue, spatial pattern, weather, irrigation, recent sprays, fertilizer history and root condition. These observations narrow alternatives but never replace analysis.
2. Match the crop, stage and plant organ
Ask the selected laboratory for its current sampling sheet before entering the field. Sufficiency ranges are tied to a particular crop, developmental stage and plant part; a young mature leaf, petiole, ear leaf or whole seedling cannot be substituted casually. Do not mix cultivars, plant ages, rootstocks, soil types or clearly different management zones in one bag. If routine monitoring is the goal, repeat the same defined organ and stage each season.
3. Collect paired, representative samples
For a disorder, make one composite from affected plants and a second from nearby normal plants of the same cultivar, age, stage and management. Keep them separate and label the exact zones. Spread subsamples across each homogeneous area instead of choosing the worst or best plant. Submit soil or root-zone samples from the same two zones when possible; tissue shows what entered the plant, while soil data help explain why availability or uptake differed.
4. Control contamination and handling
Soil, dust and foliar residues can distort micronutrient results, especially Fe and Mn. Record every recent nutrient or crop-protection spray and follow the laboratory's waiting, washing and handling instructions; some surface residues cannot be removed reliably. Use clean non-corroding tools and new breathable paper bags. Keep samples dry and cool, avoid sealed warm plastic, and deliver promptly with crop, organ, stage, zone, date and treatment history.
5. Interpret the report in context
Compare results only with the laboratory's crop-, stage- and organ-specific ranges and review the full nutrient profile. One low value does not prove that it caused the symptom; dilution by rapid growth, antagonism, root restriction or sample contamination can alter concentrations. Read affected-versus-normal tissue beside soil pH, EC, carbonate or bicarbonate where relevant, moisture, root health and treatment history. If both zones have similar tissue values, investigate non-nutritional causes before buying a corrective input.
6. Qualify the product route and verify the response
Consider WSG-Fe only when the diagnosis supports a targeted iron route and the current market label, guaranteed analysis, iron source, solubility and system compatibility fit the use. Consider WSG-Mix only when evidence supports a multi-element Fe–Zn–Mn programme; it is not a default response to any yellow crop. Record the exact lot and label, run a controlled strip with an untreated or standard comparison, keep all other nutrition equal, and repeat tissue sampling at a predefined stage. Scale only when crop response, analysis and economics agree; this guide assigns no universal rate or efficacy claim.
PRACTICAL ANSWERS
Frequently asked questions
Can leaf colour identify iron, zinc or manganese deficiency?
No. Colour and symptom position help form hypotheses, but root stress, pH, water, salinity, disease and spray injury can mimic nutrient disorders. Confirm with correctly sampled tissue and supporting field and soil evidence.
Should symptomatic and healthy leaves go into the same bag?
No. Make separate composite samples from comparable affected and normal zones and label both. Mixing removes the contrast needed for diagnosis.
Why record foliar sprays before micronutrient analysis?
Fertilizer and crop-protection residues can raise measured surface Fe, Zn, Mn or Cu, and some residues cannot be washed away reliably. The laboratory needs the history to judge whether the result is interpretable.
Does one low tissue value justify a micronutrient product?
Not automatically. Confirm the correct crop-stage range, sampling quality, paired normal comparison and root-zone causes. Then test the exact labelled product route against a control before scaling.
Technical references
- Missouri Extension — Sampling Plant Tissue and Soil for Analysis
- Penn State Extension — Mid-Season Crop Tissue Testing
- University of Minnesota Extension — Foliar testing for fruit and vegetable crops
- University of Florida IFAS — Plant Tissue Analysis and Interpretation
- DLG — Correct plant sampling for nutrient assessment
- Türkiye Ministry of Education — Preparing leaf samples for analysis
- Russian Ministry of Agriculture — Sampling plant material in agrochemical trials
This article provides product-selection and operating logic, not a legally binding application rate. Final use follows the registered label, batch documentation, water and soil analysis, and local technical guidance.